Étiquette : covid-19 (Page 3 of 4)

Community Mobility Reports

“ As global communities respond to COVID-19, we’ve heard from public health officials that the same type of aggregated, anonymized insights we use in products such as Google Maps could be helpful as they make critical decisions to combat COVID-19. These Community Mobility Reports aim to provide insights into what has changed in response to policies aimed at combating COVID-19. The reports chart movement trends over time by geography, across different categories of places such as retail and recreation, groceries and pharmacies, parks, transit stations, workplaces, and residential. ”

Source : COVID-19 Community Mobility Reports

Staying at Home During Coronavirus Is a Luxury

“Although people in all income groups are moving less than they did before the crisis, wealthier people are staying home the most, especially during the workweek. Not only that, but in nearly every state, they began doing so days before the poor, giving them a head start on social distancing as the virus spread, according to aggregated data from the location analysis company Cuebiq, which tracks about 15 million cellphone users nationwide daily.”

Source : Location Data Says It All: Staying at Home During Coronavirus Is a Luxury – The New York Times

“Last week Buzzfeed News and the Los Angeles Times featured street-level visualizations of how COVID-19 is affecting traffic patterns in major cities around the world. The visualizations were generated from Mapbox Traffic data. For this post, we dug further into our telemetry data to show how much and where movement and local travel patterns have changed around the globe during the COVID-19 pandemic.”

Source : Where and when local travel decreased from COVID-19 around the world

“Les téléphones des Suisses seront ainsi utilisés pour lutter contre la pandémie. Les analyses seront effectuées uniquement dans les espaces publics, et pas, par exemple, dans les immeubles d’habitation ni les locaux d’entreprises. Ces données ne seront pas communiquées en direct à l’Office fédéral de la santé publique (OFSP), mais dans un délai de vingt-quatre heures environ. Les autorités ne sauront pas ce qui se passe en temps réel, mais avec un certain décalage. Le but sera sans doute de déterminer si des rassemblements illégaux ont lieu plusieurs jours de suite dans des endroits publics, afin, ensuite, de prendre des mesures pour les disperser.”

Source : Swisscom aidera la Confédération à détecter les attroupements via les téléphones – Le Temps

“Asking people to choose between privacy and health is, in fact, the very root of the problem. Because this is a false choice. We can and should enjoy both privacy and health. We can choose to protect our health and stop the coronavirus epidemic not by instituting totalitarian surveillance regimes, but rather by empowering citizens. In recent weeks, some of the most successful efforts to contain the coronavirus epidemic were orchestrated by South Korea, Taiwan and Singapore. While these countries have made some use of tracking applications, they have relied far more on extensive testing, on honest reporting, and on the willing co-operation of a well-informed public.”

Source : Yuval Noah Harari: the world after coronavirus | Financial Times

A graphic with no description

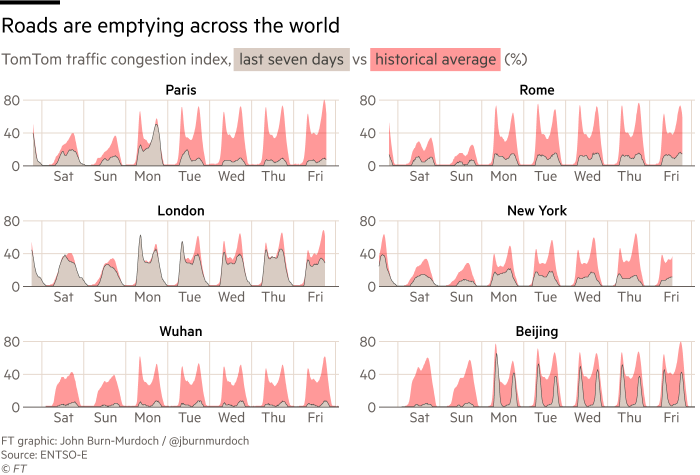
“A group of former IMF chief economists warned last weekend that a global recession had already begun, but although economic activity is slowing sharply, much official data are out of date before they are even published, given the time they take to collate.  To make up for the lack of official information, the FT has compiled a set of alternative, high-frequency measures of economic activity for different sectors which give an early indication of what to expect when official data start to become available in the coming weeks. ”

Source : Real-time data show virus’s hit to global economic activity | Financial Times

Epidemic Calculator

“At the time of writing, the coronavirus disease of 2019 remains a global health crisis of grave and uncertain magnitude. To the non-expert (such as myself), contextualizing the numbers, forecasts and epidemiological parameters described in the media and literature can be challenging.
Gabriel Goh created this calculator as an attempt to address this gap in understanding. This calculator implements a classical infectious disease model — SEIR (Susceptible → Exposed → Infected → Removed), an idealized model of spread still used in frontlines of research e.g. [Wu, et. al, Kucharski et. al].”

Source : Epidemic Calculator

« Older posts Newer posts »

© 2024 no-Flux

Theme by Anders NorenUp ↑