Fig. 1 - Google Flu Trends
On the trail of Italo Calvino’s Invisible Cities, we must recognize the multi-faceted nature of a given urban space, establish a link between individual practices and the city as a whole, explore the non-hierarchical relationship between ideal and material realities and, finally, shed light on the decisive nature of the city’s self-visibility. From this perspective, Invisible cities are probably less fictional than most urban representations, which are generally limited to buildings and transport infrastructures. At best, these representations depict main roads, traffic and commuting. Calvino, in his own way, emphasized the most important part of urbanity: its complexity.
In 1972, when the work was first published, such complexity was hard to comprehend, other than through literature. Fastidious and expensive studies were needed to perceive individual desires, representations and perceptions of specific parts of a city. Nowadays, however, we could say that things have changed significantly. The proliferation of digital footprints gives us a unique opportunity to make discreet practices more visible. Through their aggregation and recurrence, these original data provide evidences of the city in the making. Like memories from the digital devices we use, these tracks reflect an increasing part of our spatialities. Such a purpose is sensitive and includes many challenges, particularly for the social sciences, which effectively are not disposed to using such ‘unusual’ data. Yet, digital footprints have been used extensively in recent years. Many artists, designers, computer scientists and, more recently, physicists have sensed the capacity of this type of data to renew our representations of space.
However, digital footprints do have advantages that are of significant interest to the social sciences. For one, they have the great advantage of being produced independent of the researcher’s observation. They are also an exceptional raw data source that reflects a wide range of practices (taking a picture, making a call, moving around, asking for information, rating a place, etc.). However, to actually reflect urbanity, to make Invisible cities visible, digital footprints must be made explicit. Yet, it is crucial not to betray the individuals who, knowingly or unknowingly, produce these data. In response to this challenge, we should bear in mind that “We must reflect in order to measure and not measure in order to reflect” (Bachelard, 1934, p. 241).
The potential of digital footprints could thus be summarised as follows: digital footprints can reflect the complexity of urban spaces, particularly when individual practices are considered (inhabiting, mobility, identification and interaction) (Paquot, Lussault, & Younès 2007), and provided we pay special attention to the specific contexts from which they arise. Moreover, because of the diverse contexts, these data would benefit from a subtle association, if our goal is to grasp the complexity of urban practices and show innovative representations of the city.
Thus, particular attention should be given to the production of such images. From digital footprints to representations of urbanity, we will shed light on difficulties relative to each step in the process. As such, digital footprints can renew our representations of urbanity and greatly contribute to the social sciences of the city. We must be aware of both the potential and the limits of such data, give ourselves the means to make these Invisible cities easier to read and not succumb to reductionist aesthetics. This data’s potential is still largely underexploited, thus producing many meaningless, useless and inefficient images.
Digital footprints are the basis for a large body of works, in which the state of the ‘art’ and the state of the ‘research’ must be distinguished. These kinds of sources are widely used by computer scientists, designers and artists who, as mentioned, produce most of the projects and images that use digital footprints. Far from conventional research, the number of these images is actually increasing thanks to the multiplication of data and the development of new means to access and exploit them.
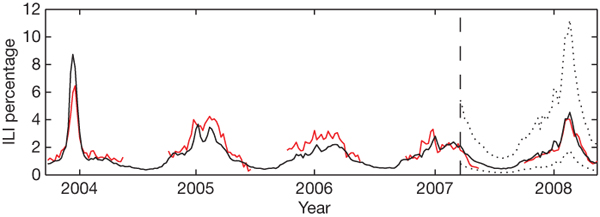
A first set of works focuses not on space but rather uses digital footprints from telecommunication practices. One of the most impressive projects of this type is Google Flu Trends1. In 2010, when demonstrating its data processing capacity, Google announced on a dedicated website that it could anticipate the flu epidemics at least as accurately as, if not better than, the U.S. Center for Disease Control (Ginsberg and al. 2008). Up until now, this example has been one of the most representative of digital footprints’ ability to reflect reality. However, it required a considerable amount of data (all the Google search queries relating to the flu over several years) as well as privileged access to this data.
Fig. 1 - Google Flu Trends
Facebook is another example, although less dramatic. A partnership between Facebook and psychology researchers led to the creation of a Gross National Happiness Index, which was created to reflect the happiness level in a particular country (the United States, in the first step of the project) (Kramer 2010). The project was based on a semantic analysis of many posts published on Facebook. Although the product of impressive research, the index is actually limited in scope owing to the lack of referents and the numerous biases relating to this particular type of tracking. Nevertheless, the study’s authors were able to identify the major periods of happiness as being linked to collective celebrations. The results of the study show the capacity of these data to reflect the world that produces them.
Finally, another set of works focuses on hyperlink networks. Following the example of PageRank, which was created using to this approach, many indexes are based on hyperlinks. Hyperlinks are not only useful for ranking webpages; they also help identify clusters among the increasing number of websites. Linkfluence is undoubtedly one of the pioneers in this area. Inherited from academic research, Linkfluence is currently one of the most representative producers of hyperlink mapping, as a private company that maps semantic, relational and temporal activities for specific topics (i.e. advertising or political campaigning) on the Web. In 2005, Linkfluence showed that opponents of the French European Constitution referendum were significantly more active than its supporters, thus showing a clear divergence between the electorate and the media. For the moment, this approach cannot really be considered scientific. It does, however, stress digital footprints’ capacity to improve the readability of complex issues.
Among digital footprints, while many are specific to the urban space, most are just demonstrations of technological prowess, with no real scientific expectations. The World Touristness Map, created by Bluemoon Interactive in 2009, using pictures from Panoramio, and Visualizing Facebook Friends, the famous map designed by Paul Bulter while interning at Facebook (exploiting 10 million friend connections) are just two examples. While these projects are quite impressive, they cannot properly be interpreted. The New City Landscape Maps by Fabian Neuhaus, a kind of ‘tweetography’ that offers density maps of tweets published in certain cities including London, New York, Munich and Paris, is a perfect example of this deficiency.
Other projects are more explicitly related to artistic explorations. Ester Polak’s Real Time Amsterdam (Fig. 2a) (2002), which recorded the movements of 75 volunteers in Amsterdam over 40 days using a GPS) and Elastic Mapping (2009), presented in Berlin are two such examples. Christian Nold’s surprising maps are also of note. Since 2004, Nold has been developing the concept of biomapping, which consists of geotracking emotion variation in urban contexts. These projects underline the strong link between digital footprints and digital mapping, embodied perfectly by self-proclaimed ‘map geeks’ like Eric Fischer, one of the most prolific in the field. Fischer blurs the frontiers between mapmakers, artists and programmers. For instance, Local and Tourists (2010), A day of Muni (2010), See something or say something (2011) and Paths through cities (2012) combine multiple skills from both cartography and computer science, with a touch of aesthetics. Archipelago (2010) by Anil Bawa-Cavia and UrbanMobs (2008) by faberNovel and Orange Labs, which exploit data from innovative sources like foursquare and cell phone tracking, are other examples of this trend. Besides their deliberate aesthetic aims, these works are more exercises in style than heuristic methods that improve scientific knowledge of cities and urbanity. Scientific approaches require a more systematic characterisation of data, more rigorous methods and more explicit images.
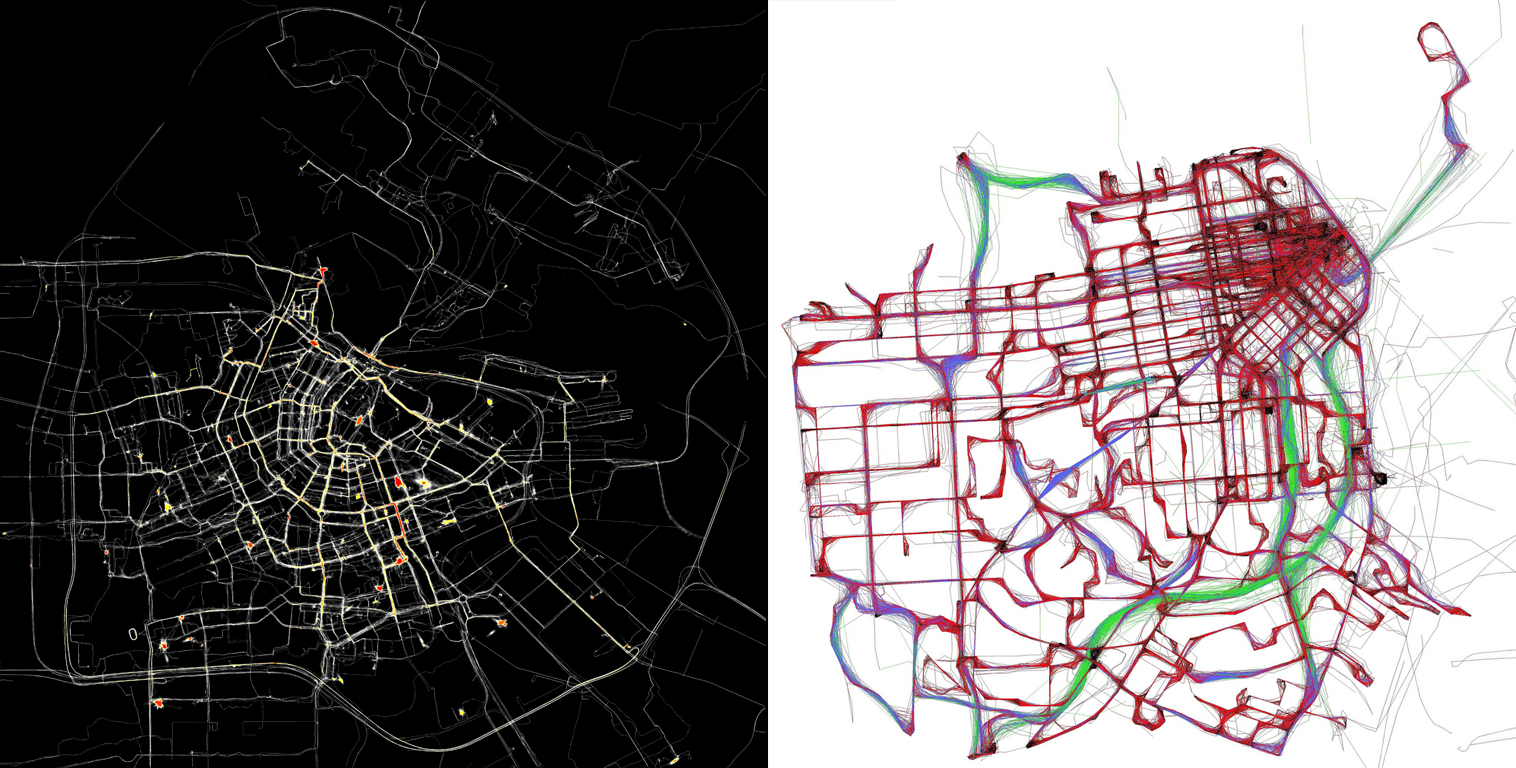
Fig. 2 - (a) Real Time Amsterdam (left) - (b) A day of Muni (right)
Following Google Flu Trends, special attention should also be paid to projects managed by companies that exploit the direct or indirect spatial dimensions of their activity. This is the case for HotMap (Microsoft Research), which provided visualisation of the most sought-after places on Virtual Earth Search and Live Search Map from January to July 2006. Tag Maps, managed by Yahoo! Research (2006), is another example. It exploits data from Flickr, or SpotRank from Skyhook, which shows the most frequented places, using a database of known locations of over 700 million Wi-Fi access points and cell towers. By exploiting various kinds of data, namely search queries, metadata from images and cell phone tracks, the three companies offer innovative and stimulating representations of space. However, grasping the veritable potential of these projects, which have largely been abandoned and served only for experimentation purposes, is difficult.
In recent years, the potential of digital footprints to apprehend urban spaces has been addressed by academic researchers as well. Several groundbreaking works have even been published in prestigious journals, such as Nature and Science, though they did not go beyond the observation that most individual movement is largely predictable. Using large sample groups (100,000 people over a period of six months (González, Hidalgo & Barabási 2008), 50,000 people over a three-month period (Song et al. 2010)), these studies treat individuals like atoms, producing interesting analyses, but with important limitations: they only confirm established facts, given that working, studying, sleeping and living are mostly static and regular practices that constitute more than 80% of our everyday life.
Another set of studies focuses more on detailed analysis of individual practices. These studies do not attempt to forecast movement but rather aim to find out where people actually spend their time during an entire day. The impetus was established in 2006, with several projects initiated by separate groups led by Nathan Eagle, Eamonn O’Neill and Carlo Ratti (Eagle & Pentland 2006; O’Neill & al. 2006; Ratti et al. 2006). These studies concentrated on MIT students, pedestrians of Bath and inhabitants of Milan. They have initiated a real revival of urban space representations.
Nowadays, digital footprints can be exploited more easily. It seems that most of the data comes from six kind of sources:
Sometimes these data records are supplemented with other information:
On the whole, these studies represent innovative works with significant prospects. They also contribute to improving knowledge of individual practices in urban spaces, and offer unconventional representations that reveal the complexity of the city through novel aggregations of individual practicies (mobility, photography, social networks, etc.).
Each of these studies is, however, limited by numerous biases due to the weak methods and data involved (cf. 2.3.2). Furthermore, as a result of the strong technical skills these methods involve, most of the studies are conducted outside of the social sciences. The fact that the data come mainly from social practices is a serious issue, since the significance of the data cannot be seriously confirmed. Lastly, many of these studies has been developed in the context of specific events and have not been tested further, thus reflecting particular and spectacular moments in the life of a city and showing exceptional rather than the everyday (Amsterdam RealTime, Real Time Rome and UrbanMobs). The recent Live Singapore project, however, developed by the Senseable City Lab, is deeply linked to common urban issues, although its current output remains more spectacular than effective and disconnected from actual individual expectations.
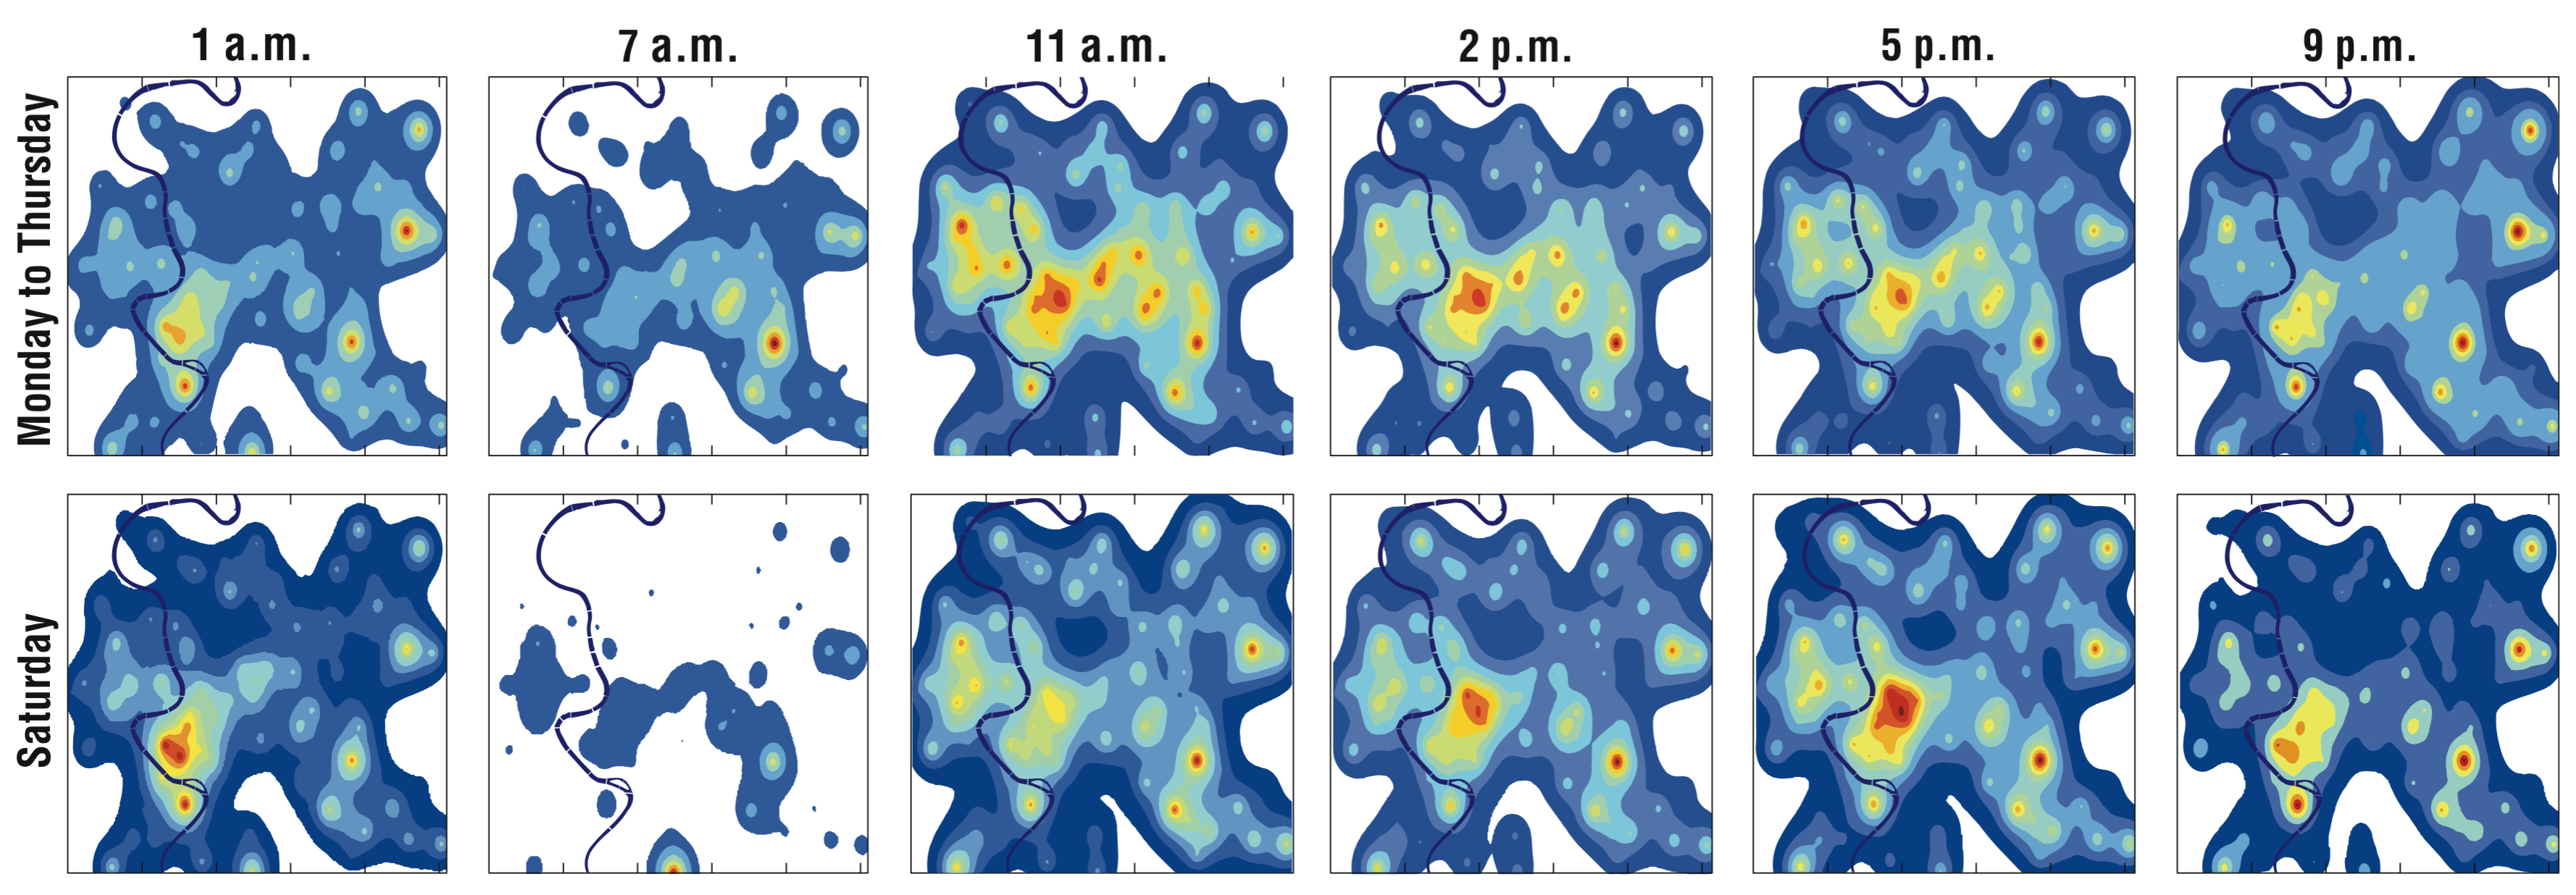
Fig. 3 - Cellular Census, Rome (J. Reades, F. Calabrese, Sevtsuk & C. Ratti 2007)
Up until now, no study has offered a transversal approach to digital footprints capable of exploiting their plurality. Moreover, no study has offered strong contextualisation for this innovative kind of data, even though this is the only way to produce usable representations of the city for researchers, urban planners as well as inhabitants. Several studies do use two types of data to improve the significance of their results: cell phones and Flickr (Girardin, Francesco Calabrese, Fiore, Carlo Ratti & Blat 2008; Girardin, Fiore, Carlo Ratti & Blat 2008), Flickr and Geograph (Purves & Edwardes 2011) and several methods of geolocalisation like GPS, Wi-Fi and cell towers (Shoval & Isaacson 2007). Furthermore, with the exception of a study managed by Foursquare data (Phithakkitnukoon & Olivier 2011), most studies concentrate on urban intensity more than on urban diversity. The complexity of urban spaces has not yet been extensively studied. However, exploring this complexity remains an important scientific issue with substantial potential.
Apart from in the social sciences, digital footprints are receiving increasing attention. In spite of this, it is important to address the potential of urban digital footprints from a social perspective, and to assess the significance and capacity of such data to improve knowledge of urban spaces by considering their complexity.
Despite the abundance of studies on digital footprints, few take significant advantage of their potential; too often are they limited to a single source (Flickr, Foursquare, cell phones, etc.). Moreover, these initiatives are generally limited to data-visualisation performances, whose challenges are mainly technical, aesthetic and promotional. This results in many projects being unexploited and unexploitable, further highlighting the potential of digital footprints. The time has come to merge these innovations in a broader perspective with a deeper social outlook, and to develop innovative methods that will help make cities and urbanity in particular easier to interpret and grasp.
Digital footprints offer an unprecedented opportunity, as they reflect practices that are quite difficult to grasp (photo shoots, movement, user reviews via web platforms like Yelp, etc.). Such information requires expensive studies, though these studies are generally far from exhaustive. Furthermore, these information sources effectively supplement conventional data (density, commuting, land registry, etc.), whose limitations are often not appropriate for analysing contemporary uses of urban spaces.
From this point of view, digital footprints offer a remarkable opportunity to renew and complete conventional ways of understanding and analysing the complexity of urbanity. From a large scale to just a few blocks, they help reveal unequal dynamics and the attractiveness that characterises certain neighbourhoods of certain cities. Moreover, because these data reflect specific practices, they show the city from a new perspective much more closely linked to daily activities and the city in the making. One can even assume that, under certain circumstances, digital footprints could significantly improve the readability of large cities and better convey their urbanity than classic indicators such as density or commuting.
It is essential to exploit the potential of digital footprints to better understand urban spaces and their complexity, their intensity and their dynamics. This means developing a better knowledge of both urban spaces themselves and means for understanding them. The following issues are of particular importance:
After such investigations, the social sciences will be fully able to take part in this dynamic, though initiated by information and computer science, design and art. Notions such as digital footprints and cellular census will be in accordance with the particular requirements of social issues. Questioning the potential of digital footprints in the social sciences is indeed a prerequisite for considering how such data can help us understand the city and the complexity of urban spaces.
Connections between digital technology and cities were identified long before the use of digital footprints. Several pioneers have clearly shown the importance of the spatial dimension of digital technologies (Bakis 2001; Bakis 1994; 2004; Beaude 2008; Dodge & Kitchin 2001; Éveno & Bakis 2000; Éveno 2004a; 2004b; Kitchin 1998; Mitchell 1996) and stressed the idea that digital cities are not merely digital transpositions of urban space but rather a complex combination of cities and digital technology. From this perspective, a digital city is rather an extensively connected city, where digital data and digital services are available to inhabitants (Aurigi 2006; Dykes et al. 2010). A digital city is more about hybridisation than virtualisation. At present, it is clear that telecommunication and digital technology are not alternatives to urban spaces; cities are actually the perfect place for these technologies (Bakis 2001; Hardey 2011; Mitchell 2000). Furthermore, these technologies are not only efficient for reducing distances but are also extremely useful for managing proximity (Castells 2001; Éveno 2004b; Gordon & Silva 2011).
The development of ubiquitous computing - that is, the combination of the seeming disappearance and functional omnipresence of digital technologies (Galloway 2004; Greenfield 2006) obliges all stakeholders to think about the plurality of cities in full consideration of digital technology (Graham 2004). From this standpoint, digital footprints are at the heart of contemporary issues in urban studies, perfectly situated between digital technologies and cities. However, going from digital footprints to urbanity is no small step. The road ahead is full of challenges. To avoid losing our way, it is best to start with the expected target to know where we are going.
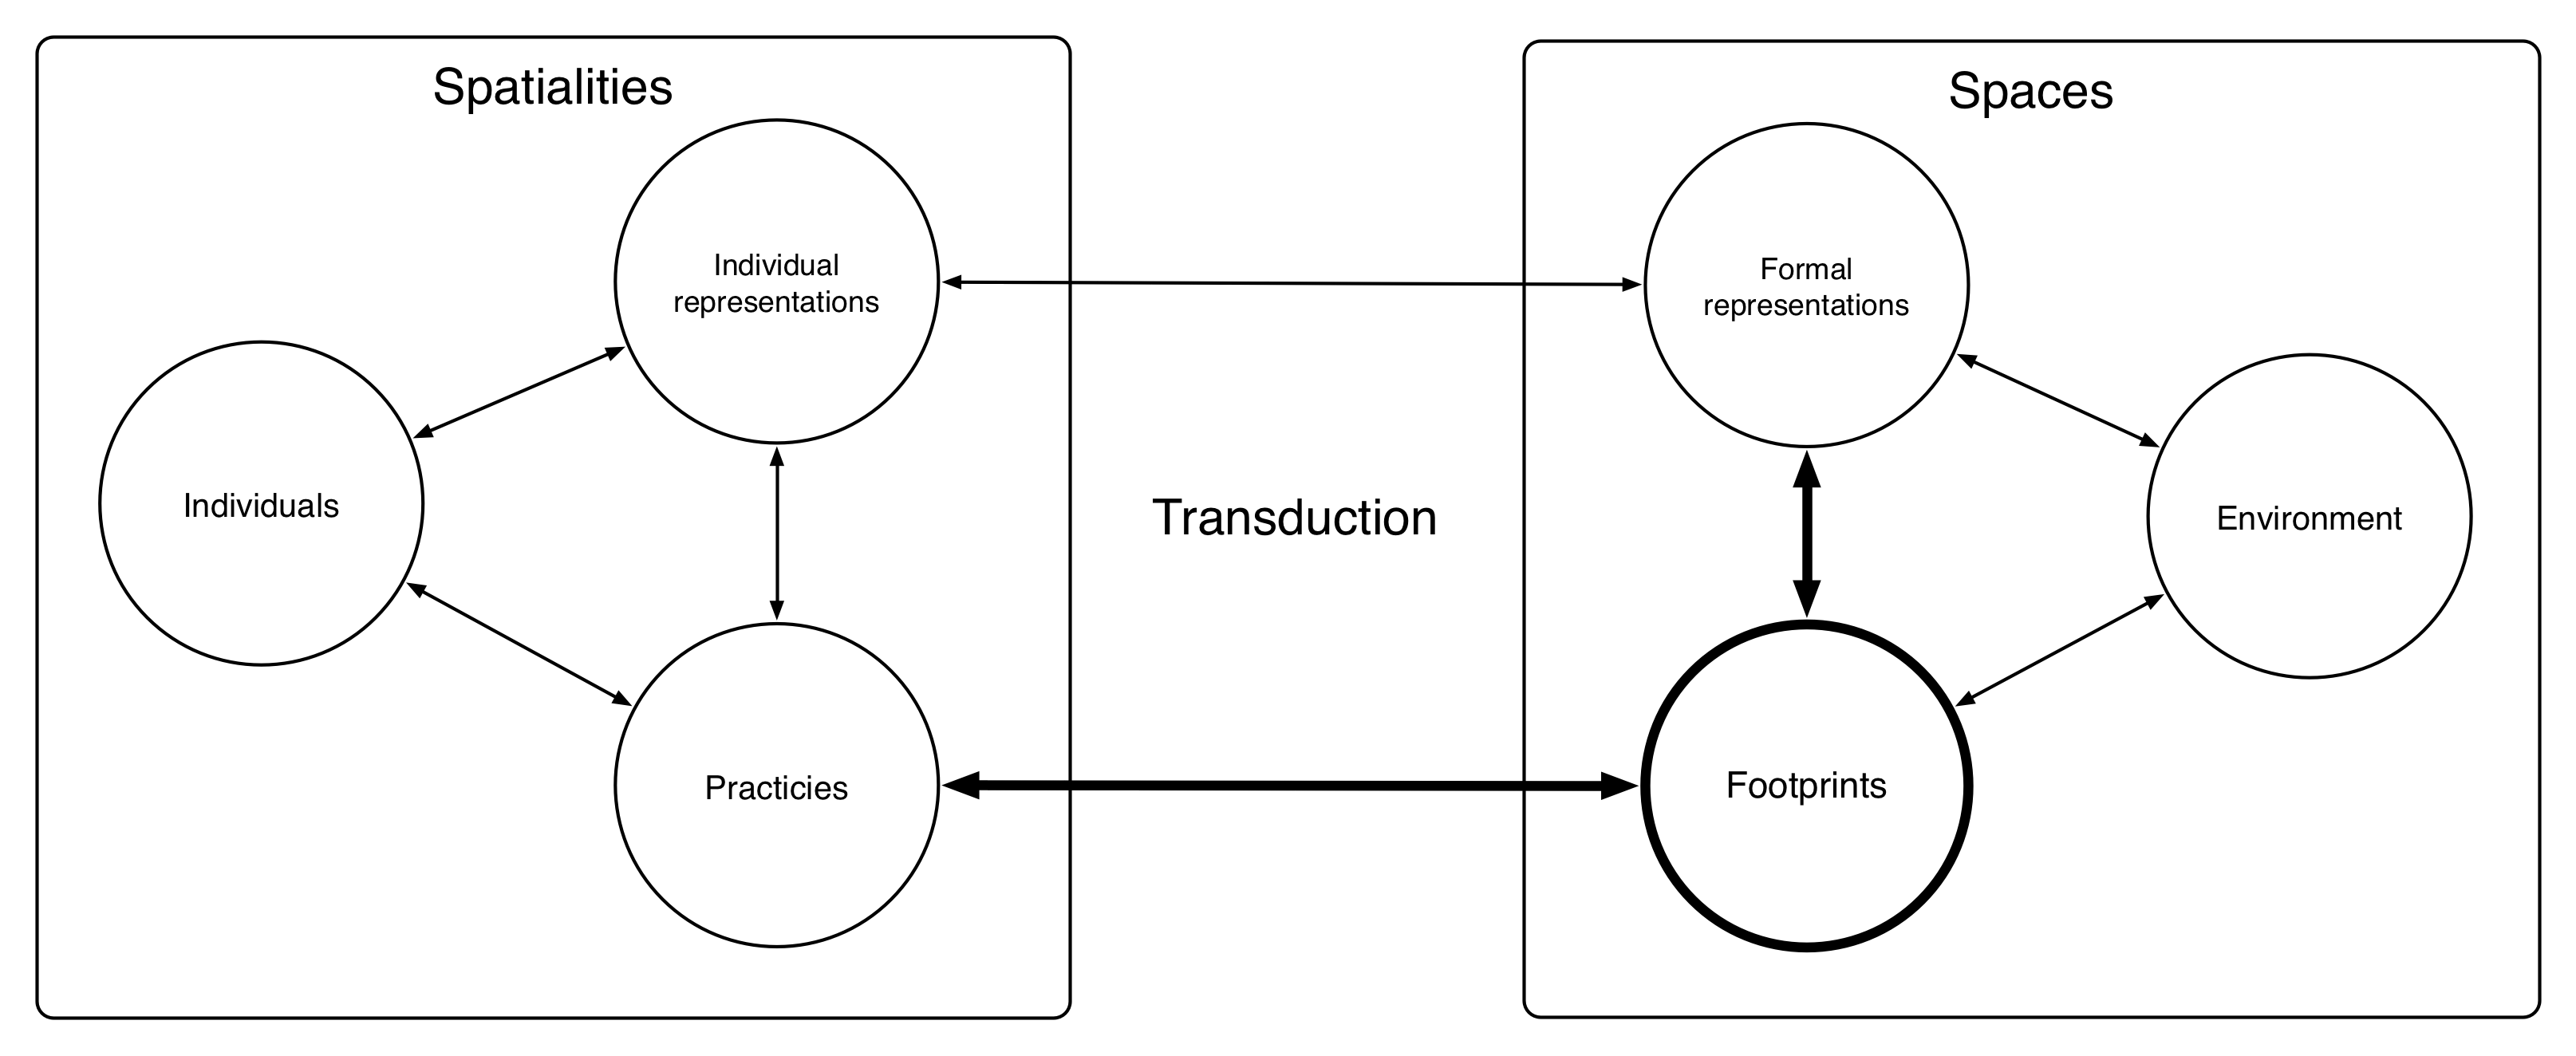
Fig. 4 - From digital footprints to urbanity
In the beginning was the city, although, since the end of the 19th century (and particularly during the second half of the 20th century), increasing urbanisation at the global scale has greatly affected its significance and readability. Nowadays, the notion of city is too limited to convey the contemporary phenomenon of densification, which favours networks, since the significance of the contiguous built-up areas has been steadily decreasing. This is how the ‘culture of limit’ has gradually disappeared, just as the notions of ‘city’ and ‘country’ with the notion of ‘urban’ (Choay, 1994). Only the essence of the notion of ‘city’ has been preserved, that is its specific capacity to improve productivity (Bairoch, 1985), its unrivalled capacity to maximize social interaction (Claval, 1981) and to create physical contact while preserving social distance (Wirth, 1938). In fact, “the air of the city makes you free” precisely because “the area of the city makes you free” (Lévy, 1996).
However, this complexity can be grasped through two attributes that perfectly define urbanity: density and diversity (Lévy, 1994). High urbanity can be described as high density and high diversity, two ways of improving social interaction. Density is the quantity of things present in a given area. The notion of diversity typifies the variety of things in a given area, relative to a reference area. Diversity can be intra- or inter-dimensional, that is, respectively, many differences in a specific dimension (services, buildings, individuals) or between many dimensions. In other words, the notion of urbanity describes the urban quality of a given space, the result of the density and diversity of social realities. Hence, we could consider infinite potentials, which could be qualified by various spatial ideal-types (geotypes) that correspond to specific endowments of these attributes. For instance, the open-list of geotypes includes central, sub-urban, peri-urban, infra-urban, meta-urban, para-urban and peri-central (Levy, 1994).
Moreover, distinguishing between potential and effective urbanity is essential, in other words, between a priori and a posteriori urbanity (Lévy 1994; 1996; 1999). This fundamental distinction emphasizes the fact that it is important not to confuse a city’s interaction potential with the actualization of this potential through daily practices. A priori urbanity can be grasped thanks to spatial aggregated indicators. For instance, the density and diversity of buildings, inhabitants, shops and transportation modes are many ways of qualifying a priori urbanity. In the architectural field, this issue has been tackled through space syntax. This visual method aims at revealing a space’s potential through road connectivity (fig. 5 - a) and density (more recently, fig. 5 - b).
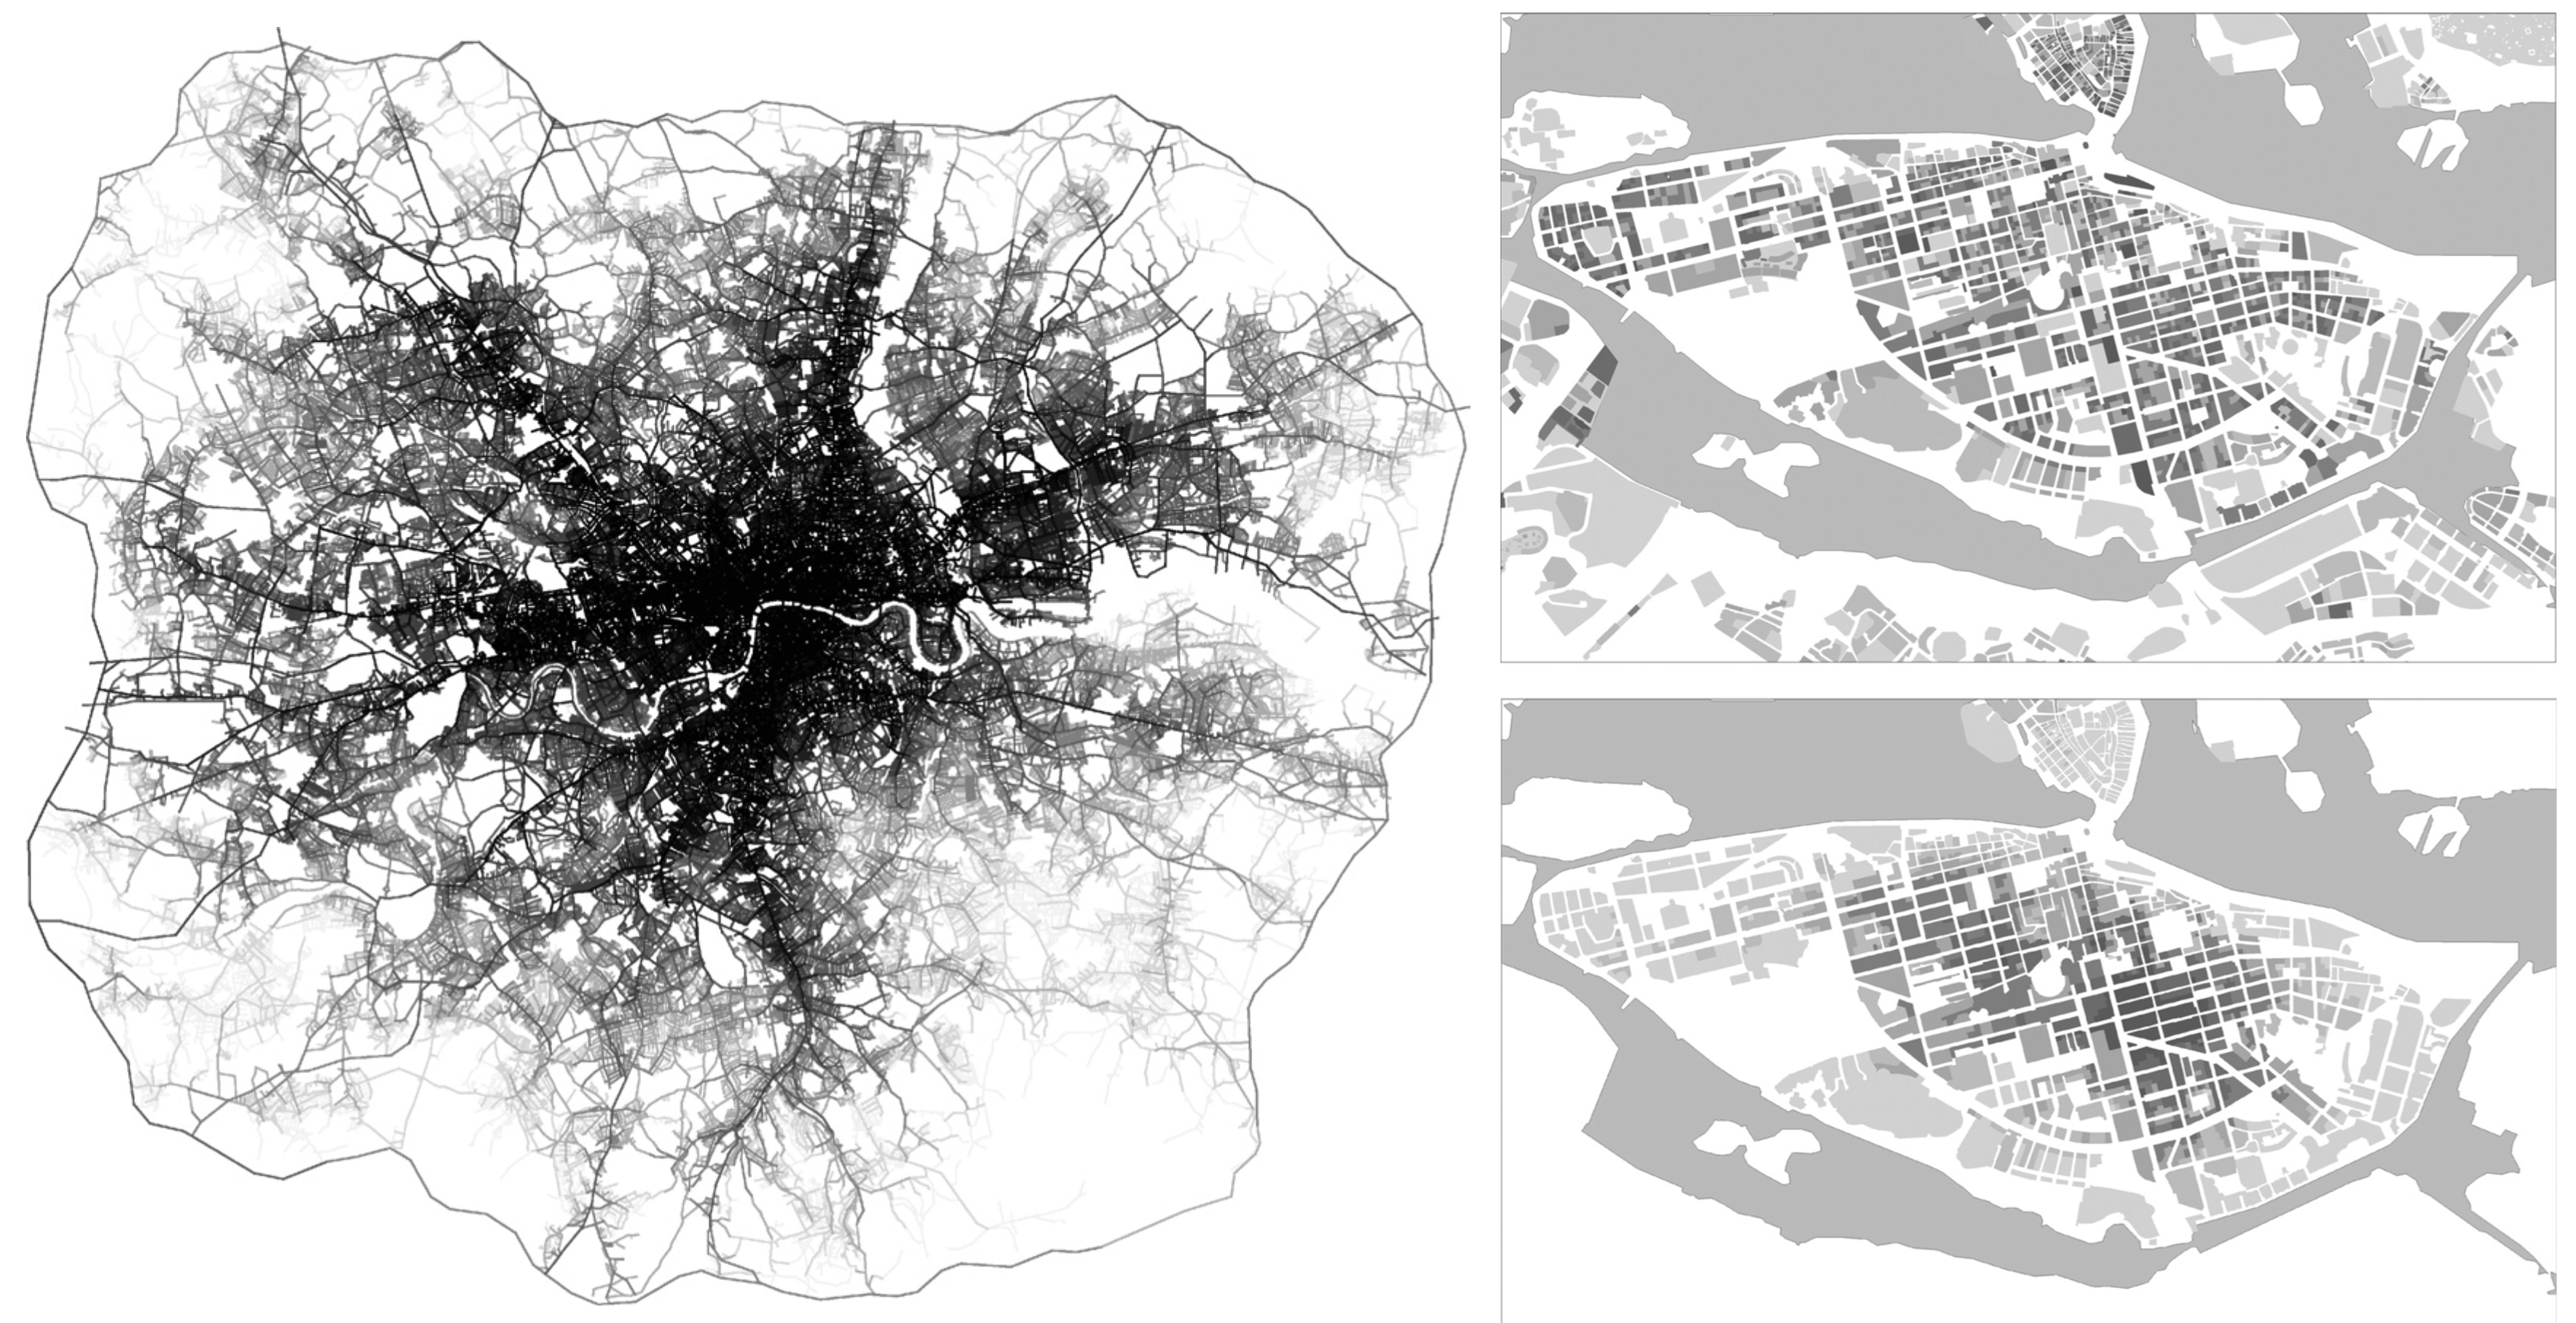
Figure 5 - The spatial syntax of urban segregation, London
M25 on the left (a) and Stockholm on the right (b) (Vaughan 2007)
A priori urbanity is by far the most used, although a posteriori urbanity is being increasingly considered, particularly in the context of mobility, urban planning and even hoarding boards, which require more than just a priori expectations. Nevertheless, in cases where data relative to urban practices are not only unattainable or too expensive, they are usually confidential as well. Census and mobility surveys do not actually compensate for this limit, as they generally focus on housing and commuting, which represent the most predictable parts of urban practices. In fact, a posteriori urbanity is less exploited than a priori urbanity because it is far more difficult to estimate.
This unfortunate difficulty must be overcome, since a posteriori urbanity is particularly useful for understanding urban spaces, especially the adequacy between its potentiality and its actuality. The problem stems from the complexity and cost of the apparatus used to assess such urbanity. This supposes having access to a considerable amount of data that is constantly being renewed. It also requires considering not only space, but time, so as to respect the temporal dimension of spatial practices, as spaces empty and fill according to the time of the day, week and year (Scalab, 2004).
This issue is not new but has been greatly reconsidered since geolocation–based digital footprints have emerged. During the past decade, new players who were not directly involved in producing urbanity indicators have become by far the largest producers of spatial information, thanks to the massive use of cell phones and GPS- equipped devices (Nova 2009). Nowadays, the commercial value of these data is considerable but still confidential. Furthermore, firms such as TomTom, Google, Orange and Swisscom are not fully aware of this potential, beyond the specific context in which these data have been produced (traffic forecasts, cell phone tower regulation, security, etc.). In this respect, digital footprints based on geolocation are a remarkable opportunity for society to significantly improve the available means for reading, understanding and managing what has become common space for most of humanity.
The fusion of digital technology with telecommunication in recent years has dramatically improved data computing capacity and hence improved innovative services that were formerly unimaginable with analogical technologies. Nowadays, processing capacity is so great that digital technologies are now part of most of our telecommunication devices (radios, televisions, telephones, etc.). The Internet is the most advanced outcome of this merger. Now integrated even in our cell phones, this ‘ubiquitous’ technology is virtually everywhere. The result is a profound renewal of our environment, which poses a serious challenge to the social sciences.
The spreading of digital technologies to most of our social mediation devices results in a proclivity to leave footprints that are far more visible and greater in number than those usually left by our own bodies. Identifying and exploiting these footprints is clearly less costly, given that they are ‘centralised’ and easy to manipulate. Digital footprints, and the spatial data produced by digital devices in particular, are not only important in terms of their relative quality but also their quantity, as their number is constantly increasing with the spread of digital technology to daily activities.
This trend, which has been clearly identified in recent years, challenges the quantitative methods used in the social sciences and revives the old debate on the pertinence of such an approach. The current social issue surrounding digital footprints is so-called big data, which represents such a vast quantity of data that quality and relevance are suposed to emerge from quantity. Big data refers to an unprecedented accumulation of data on individual social practices (Twitter, Wikipedia, Facebook, etc.) (Lazer et al. 2009), historical perspectives (urban statistics) (Bettencourt & West 2010), newspapers (Leetaru 2011) and books (Michel et al. 2011).
While opinion remains divided, the potential of big data is generally accepted. Although the risk of reductionism and imperialism of the physical sciences, computer science and mathematics exists, the emergence of big data is seen as an opportunity for the social sciences to re-examine its methods (Torrens 2010) and develop closer relationships with other disciplines (Paradiso 2011), following the ethno-mining approach (Aipperspach and al. 2006). It is also an opportunity to reconcile quantitative and critical geography, the latter of which only occasionally acknowledges the potential this data has to confirm their assertions (Kwan & Schwanen 2011). Nevertheless, some of social scientists familiar with the subject forewarn of the many aporia relative to big data. They stress the fact that the social sciences are not characterised by the quantity of data available but its subjective nature, which can be summed up as: facts and data do not speak for themselves.
In a recent text, danah Boyd and Kate Crawford cite ‘six provocations’ that perfectly capture the limits of big data (Boyd & Crawford, 2011) and, consequently, of digital footprints.
A few other ‘provocations’ can be added to this list. First, correlation is not causality which is why it is crucial to know the specific production context of any type of data – the minimum requirement for producing any meaning at all. Furthermore, the social sciences cannot aspire to discover social laws comparable to physical laws, since individuals cannot be compared to objects. Reflexivity - that is self-awareness - makes a major distinction between object and subject. In particular, subjects can change as a result of experience, and act differently in similar conditions. A mere social law can change society; hence any social law appears as nonsense (Popper, 1957). This is probably why Google Flu Trends eventualy failed. In the 2012/2013 season, it predicted twice as many doctors' visits as the US Centers for Disease Control and Prevention (CDC) eventually recorded. In facts, the Google Flu Trends consistently overestimated flu-related visits over the last years. It shows that using big data to predict the future isn't as easy as it looks, while GFT is often held up as an exemplary use of big data (Lazer & al., 2014).
Therefore, digital footprints do not speak for themselves, and require our full attention. The possible analogies that can be made between digital footprints and the practices that produce them must be seriously questioned (Beaude 2009; 2010). In particular, it is important to stress that they are not “raw data”. This notion is an oxymoron (Bowker 2008) that supposes data produced without a socio-technical environment. Thus, it is essential to identify the context, quality and representativeness of all digital footprints, and to distinguish between active footprints (knowingly produced), passive footprints (unwittingly produced), personal footprints (produced for oneself) and social footprints (produced to be shared).
Henceforth, many biases can be identified, one of the most important being the highly unreliable social and spatial sampling of these footprints. Data from cell phones are among the most reliable and most abundant, but are also among the most inaccessible. Metadata from Flickr, however, are among the least representative but also the most accessible. Major sampling differences can nevertheless be seen for the same type of data (between Flickr and Geograph, for instance (Purves & Edwardes, 2011, Fig. 6)). Studies requiring specific devices face another important bias: people must be directly involved in the study (Bayir, Demirbas & N. Eagle 2009; Nathan Eagle & Pentland 2009; Nathan Eagle & Sandy Pentland 2006). Moreover, these studies have shown that it is difficult to build continuous data given the limited energy autonomy of such devices, of which cell phones are no exception. Furthermore, despite the apparent accuracy of digital footprints, their geolocation is not so reliable. For example, the average accuracy of data produced by cell phones is approximately 320 meters (Francesco Calabrese, Pereira, Di Lorenzo, Liu & Ratti 2010) and varies from 3.5 m2 to 8000 m2 in the metropolitan area of Paris (Olteanu, Couronné & Fen-Chong 2011). Digital footprints present so many challenges that some researchers have proposed a typology of their specific limits: representativeness, accuracy, certainty and granularity (Olteanu et al., 2011).
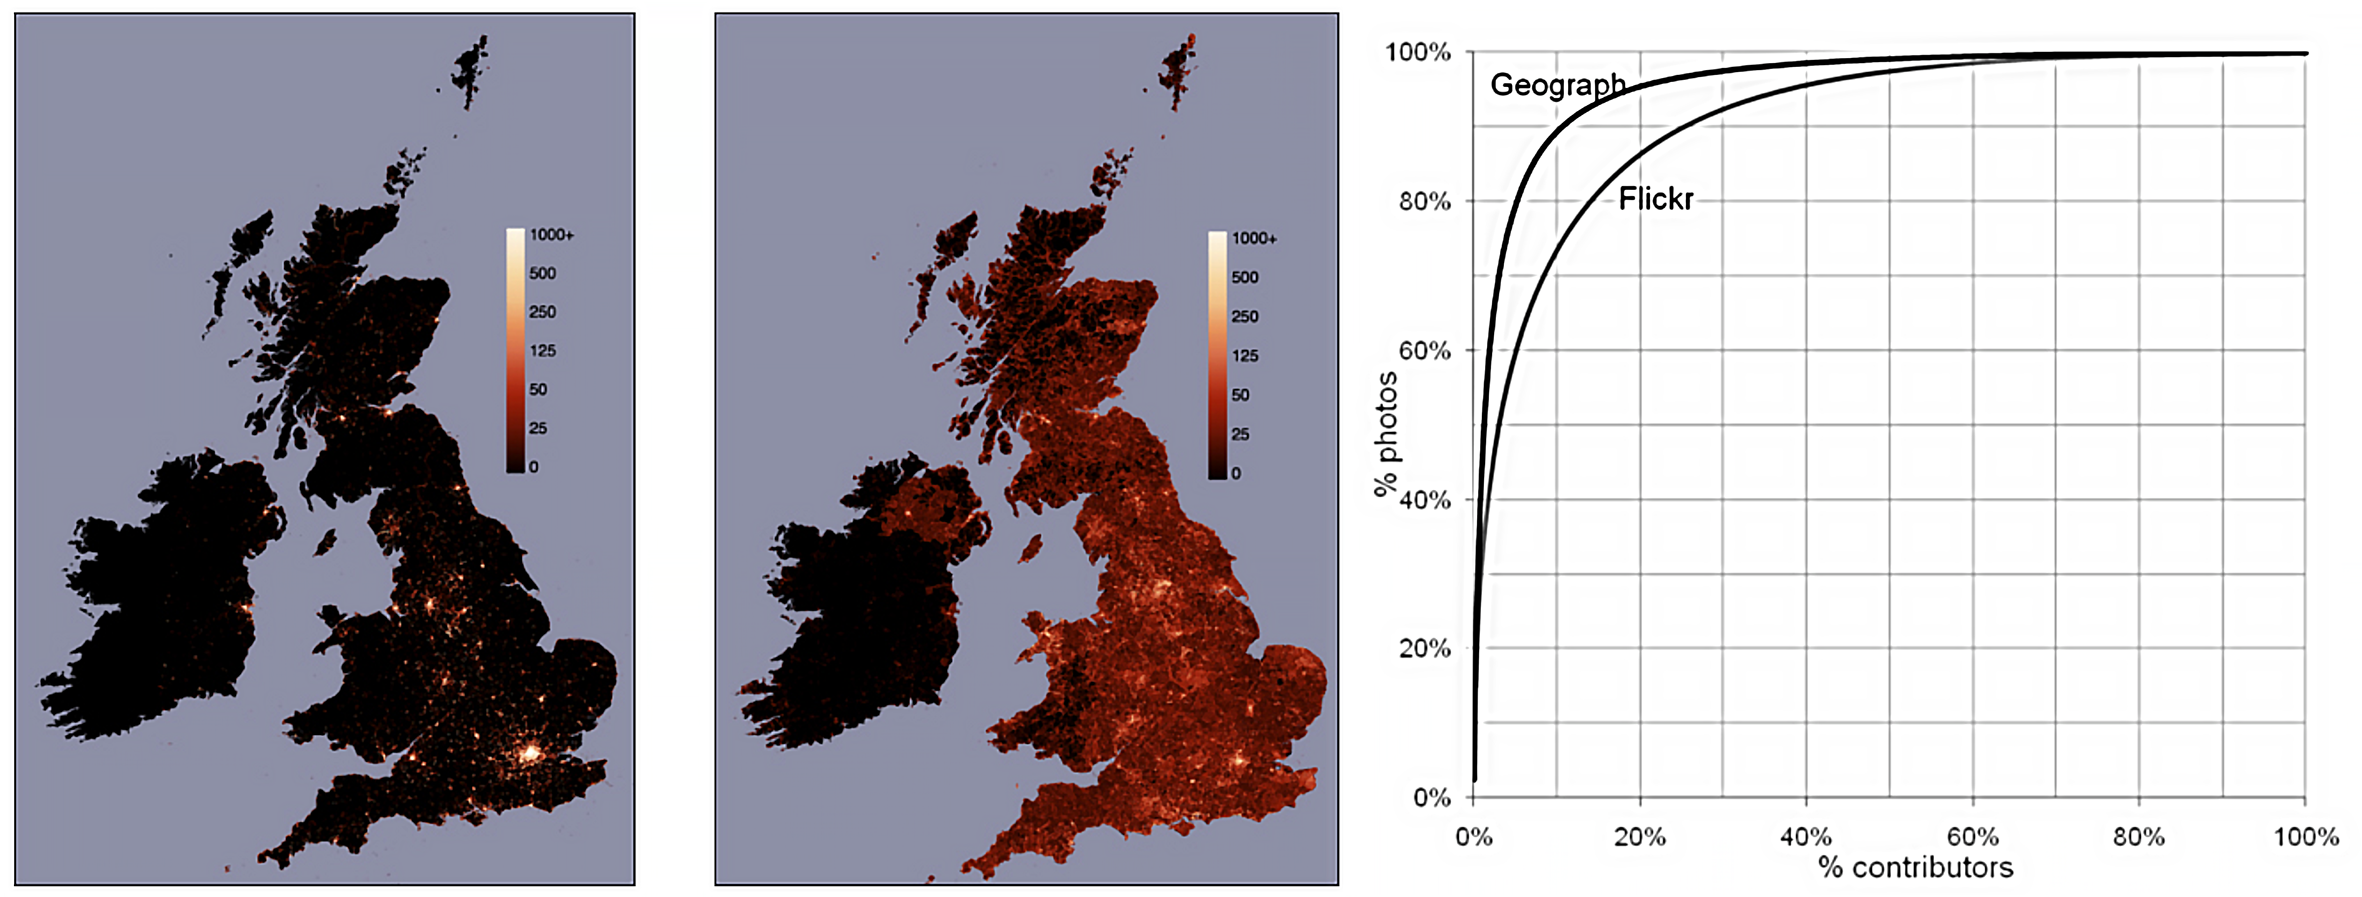
Fig. 6 – Unequal space (left) and social (right) representativity (Purves & Edwardes, 2011)
These basic biases remind us how important it is to ask the right questions to the right data, and to know their specific limits. However, Google Flu Trend is an enlightening example in that it shows how the aggregation of data can provide meaningful indicators, if the data are used to answer specific questions with appropriate methods.
Another example is the strong relationship between a place rating (i.e. a restaurant) and the distance of this place from home. Called “voting with your feet” by its authors (Froehlich et al. 2006), it provides an interesting nuance to the more extensive notion of ‘cellular census’ (Reades et al. 2007).
Digital footprints relative to urbanity are not exempt from these biases, but specific methods can help to prevent the majority of them. This requires identifying the various biases for each type of data (pictures, cell phones, social platforms, etc.) and to assess the difficulty there is in obtaining and using them, considering that some of them are particularly strategic or confidential.
Digital footprints are all the more important given they are not a mere reflection of urbanity: they are liable to change it. This phenomenon requires a differentiation between space and spatiality (Fig. 4), that is between space of action and spatial action (Lussault 2007; Lussault & Stock 2010). Individuals therefore coproduce space, which is concurrently a support for action. Thus, practices leave footprints in space, which are used to create formal representations (maps for instance) that become supports for action through individual representations of space. Once digital footprints have been analysed and formalised, they are used in a wide range of devices that help us understand a given city. The emergence of urban representations built from digital footprints is thus a major issue for the potential of urbanity, as they greatly contribute to the actualization of the city.
A distinction must therefore be made between how digital footprints are represented formally (i.e. how they are made visible) and the spatial transduction phenomenon (Dodge & Kitchin 2005), following the works of Simondon and Mackenzie (Mackenzie 2002). Spatial transduction differentiates the process of representation from the ontogenic process of space. This process follows a positive feedback loop that deeply links practices and digital footprints, since one cannot be the sole consequence of the other. ‘Transduction’ is the process by which space becomes the environment that leads to its own genesis.
Consequently, the representations of urban spaces that emerge from digital footprints cannot be reduced to a mere evidence of urban practices; they are eminent constructions that emphasize just how devices and arrangements are built together (Merzeau 2009). Here lies an opportunity to explore urbanity with a renewed and increased acuity, which is crucial if our goal is to identify the advantages and disadvantages of resorting to technical mediations (Latour & Hermant 1998). Representations do not only simplify reality, but proceed from a set of operations (filtering, standardisation, accentuation, differentiation) that respect conventions within a particular field. Moreover, the process of reduction adds new specific property (Lynch, 1990). Finally, as the last theory of perception suggests, the latter cannot be reduced to simply a passive process. Perception, on the contrary, is a full experience rather than a reception of experiences (Gibson 1986, 239). In this respect, how we perceive a city while reading a map is also an urban experience. This is why such perception plays a key role in all our representations and in many experiences, territorial, or not.
Hence, the study of the relationship between digital footprints and urbanity requires accurate identification of the context in which these footprints are produced (Fig. 4, 1) and an understanding of how we can manage the process that takes us from footprints to formal representations of urban spaces (Fig. 4, 2). In particular, we must focus on the technical devices involved, as well as the individuals who produce and use them in urban spaces. Particular attention should also be paid to the algorithms used and their ethical and political dimensions, as footprints have become a subtle component of the city through transduction.
The importance of algorithms has actually been stressed in recent years, following Lawrence Lessig’s work. In Code and Other Laws of Cyberspace (Lessig 1999), he stresses the importance of code, highlighting the main forces that regulate people’s behaviours as well as the production of data: market, laws, norms, architecture and, code. Rob Kitchin and Martin Dodge transposed this concept to space, developing the notion of Code/Space (Dodge & Kitchin, 2005; 2011) to describe the increasing dependence between spaces and codes. However, they did not apply this notion to representations, but rather essentially to usual functional urban devices (traffic regulation, airports, etc.).
The spread of digital devices to all urban spaces (Galloway 2004; Greenfield 2006) has resulted in the proliferation of digital footprints, calling us to seriously question this new kind of data and not wait for a major failure to realize how important they are (Thrift 2004; Thrift & French 2002). Many scientists have attempted to underline the power code has to shape the world in recent years. For instance, Stephan Graham proposed the notion of software-sorted geographies while suggesting increased attention to a spatial politics of code (Graham 2005).
A rigorous analysis of all digital footprints is thus required to improve their ability to contribute to strong indicators of urbanity. With this in mind, we must be as cautious with digital footprints as we are with conventional data sources, and consider their respective qualities. Many experimental studies in different urban spaces must be carried out to understand the strengths and limits of this kind of data. Furthermore, each digital footprint must be systematically qualified - from its sources to rigorous representations of urbanity - as a precondition for any study. Each type of source considered should be subject to a specific survey of individuals who have been actively or passively involved in their production.
Following the example of Social Networks Sites studies (Boyd & Ellison 2007; Hargittai 2007), we must characterise the users of these devices to better define what we can expect from digital footprints. This is particularly important, as many ICT usage studies have shown the importance of context. However, when we consider Volunteered Geographic Information issues (Elwood 2008; Flanagin & Metzger 2008; Goodchild 2007) or naïve geography (Egenhofer & Mark 1995), the context is always decisive for understanding the true potential of these data.
The four steps proposed by Ola Söderström for analysing images (context, production, use and materialisation) (Söderström 2000) should also be applied to all productions that involve digital footprints. Moreover, the performative propension of representations (Lussault 1998; 2007) would be greater, and hence more insidious. Digital footprints are not immune to the ‘reality effect’. Thus should transduction via digital footprints must be considered with great care. Otherwise, the proliferation of digital footprints and the resulting representations will greatly alter urban representations, thus changing the city in an unexpected way.
Note : This text is strongly related to a research conducted in collaboration with Nicolas Nova (Head, Switzerland).