
 Work in progress, cartogramme différencié (Pôle cartographie Choros-EPFL) réalisé avec D3.js.
Étiquette : visualisation (Page 4 of 8)

Work in progress, cartogramme différencié (Pôle cartographie Choros-EPFL) réalisé avec D3.js.

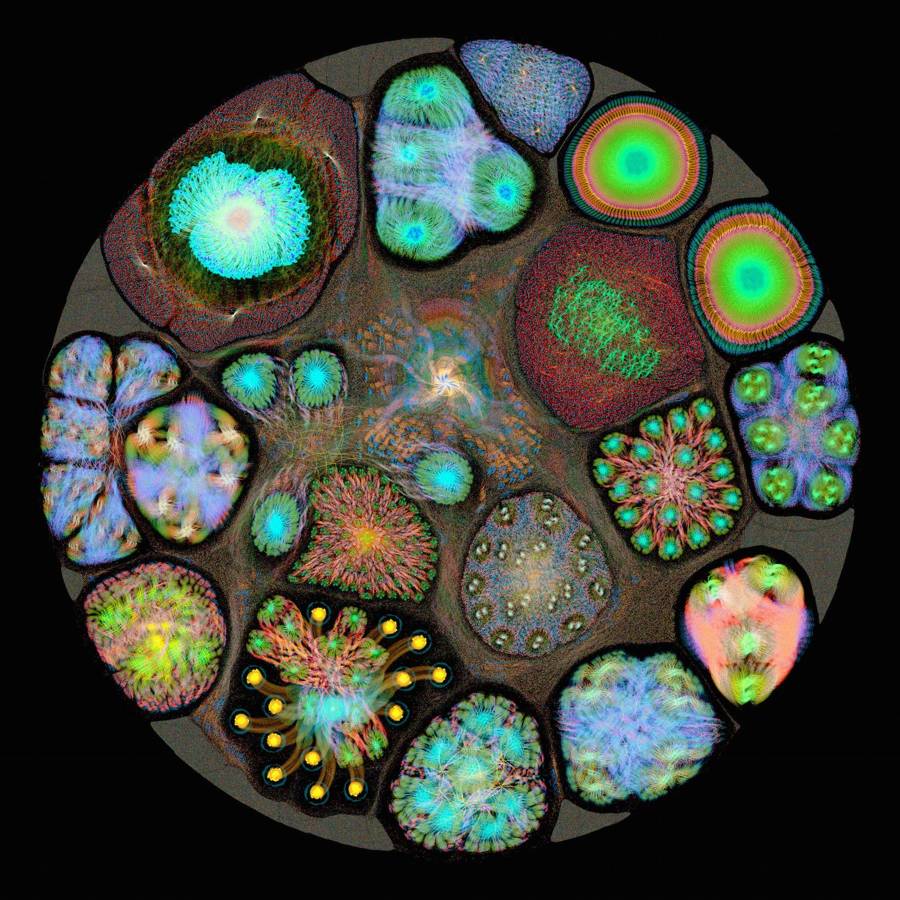
« Bristol-based Graphcore has used its AI processing units and software to create maps of what happens during a machine learning process ».
Source : ‘AI brain scans’ reveal what happens inside machine learning

« L’université de Southampton a conçu une nouvelle méthode pour établir une carte détaillée de la pauvreté : elle s’appuie sur des images satellites et les données d’utilisation des smartphones. Sa précision est censée faciliter les politiques de développement des gouvernements ».

« October 30th, 2010 marks the day that my sister Amy and I founded Meta on a mission to unlock scientific knowledge and accelerate the pace of discovery. In six years, through the hands and minds of our talented team of engineers and scientists, we figured out how to use artificial intelligence to analyze new scientific knowledge as it’s published – along with the majority of what has been written, throughout modern history. Those efforts have led us to today.I am excited to announce that Meta will be joining the Chan Zuckerberg Initiative to bring what we have built to the entire scientific community, toward their goal to cure, prevent, or manage all diseases by the end of the century ».
Source : Meta – AI for Science

Hiding isn’t a bug of visualization, it’s a feature. It’s not just fanciful visualizations that do it: their poor cousins, spreadsheets, do it too — with much more impact. My point isn’t to condemn visualization, of course — that would be ridiculous. Every serious decision made anywhere in the world now — in government, business, manufacturing, construction, science, education, civil society, and the military — is fundamentally shaped by visualization. That is why we need to think more seriously about how
Source : How to Lie with Analytics, Ted Byfield – Mozilla Internet Citizen

The electorate is increasingly divided by race, education, gender and generation, and these fissures could grow even wider in the 2016 election. Below, new estimates of turnout and support for more than 8,000 different groups.
Source : The Voting Habits of Americans Like You – The New York Times

Cartes de narration. Tout le monde a une histoire à raconter. Exploitez toute la puissance des cartes pour raconter la vôtre.
Source : Cartes de narration | Story Maps
